Kategoria katika Minton
Kituo cha GesiMarekebisho na Matengenezo ya MagariMwili kutengenezaKampuni ya Kuagiza na Kusafirisha BidhaaKarakana ya MashineKazi za MetaliKichapishi cha BiasharaMtengenezaji wa Vifaa vya UmemeMtengenezaji wa Vinywaji Visivyo na PombeMuuzaji wa Jumla wa Vifaa vya KielektronikiUzalishaji wa Viwandani na UjenziMaduka ya harusiShirika la Huduma za JamiiMkadarasi wa HVACMkandarasi wa Ujenzi wa MajengoDuka la Chakula cha AfyaKijapani migahawaMikahawaSamani madukaUbunifu na Ujenzi wa MandhariHuduma za Uwekaji HesabuMpangaji FedhaMwanasheriaWakala wa BimaZa saluniHuduma ya Biashara kwa BiasharaWakala wa Mali isiyohamishikaDuka la ZawadiYa jumla ya kuhifadhiKampuni ya MaloriUsafirishaji/usafirishaji wa kibiashara
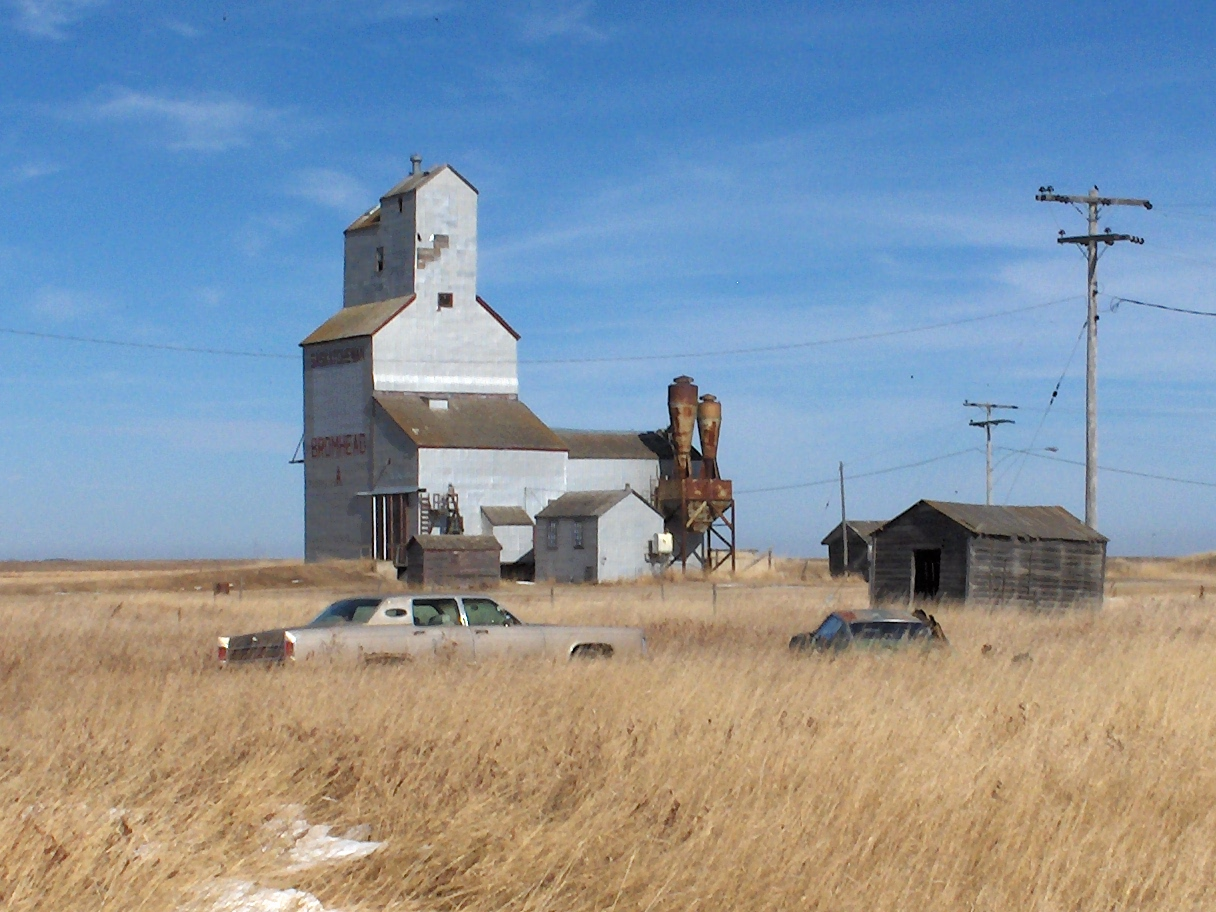
Viwanda
Mgawanyo wa biashara kwa sekta katika Minton
| Maelezo ya Viwanda | Idadi ya Uanzishwaji | Umri wa Wastani wa Biashara |
|---|---|---|
| Utengenezaji wa magari | 67 | — |
| Mikahawa | 49 | — |
| Duka za vifaa vya elektroniki | 41 | — |
| Ujenzi mwingine | 39 | — |
| Haifikiwi | 38 | 56 year |
| Madaktari wa meno | 38 | — |
| Za saluni | 36 | — |
| Usafirishaji/usafirishaji wa kibiashara | 33 | — |
| Ujenzi wa majengo | 29 | — |
| Afya na matibabu | 29 | — |
| Uuzaji kijumla wa mashine | 28 | — |
| Majengo | 27 | — |
| Wahasibu | 26 | — |
| Manunuzi | 25 | — |
| Sanaa ya mazingira | 23 | — |
| Elimu | 23 | — |
| Waganga na Wafanya upasuaji | 21 | — |
| Uanasheria | 20 | — |
| Duka la vipuri vya chuma | 20 | — |
| Zawadi, kadi na vifaa vya chama | 19 | — |
| Mboga migahawa | 19 | — |
| Udhibiti wa shirika | 19 | — |
| Huduma za kifedha | 18 | — |
Ramani ya Minton
Ramani inayoingiliana
Idadi ya watu ya Minton
Miaka 1975 hadi 2020
| Data | 1975 | 1990 | 2000 | 2015 | 2020 |
|---|---|---|---|---|---|
| Idadi ya Watu | 21 | 42 | 47 | 66 | 69 |
| Uzani wa Idadi ya Watu | 67.2 / km² | 134.4 / km² | 150.4 / km² | 211.2 / km² | 220.8 / km² |
Vyanzo: JRC (European Commission's Joint Research Centre) kazi ya GHS built-up grid
Mabadiliko ya idadi ya watu ya Minton kutoka 2000 hadi 2015
Ongezeko la 40.4% kutoka mwaka 2000 hadi 2015
| Location | Mabadiliko tangu 1975 | Mabadiliko tangu 1990 | Mabadiliko tangu 2000 |
|---|---|---|---|
| Minton | +214.3% | +57.1% | +40.4% |
| Saskatchewan | +68.7% | +35.9% | +19.9% |
| Kanada | +55.8% | +30.2% | +17.2% |
Vyanzo: JRC (European Commission's Joint Research Centre) kazi ya GHS built-up grid
Msongamano wa watu wa Minton
Msongamano wa watu: 221 / km²
| Location | Idadi ya Watu | Area | Msongamano |
|---|---|---|---|
| Minton | 69 | 0.313 km² | 221 / km² |
| Saskatchewan | 1.1 million | 652,352.6 km² | 1.7 / km² |
| Kanada | 35.5 million | 9,875,295.4 km² | 3.6 / km² |
Vyanzo: JRC (European Commission's Joint Research Centre) kazi ya GHS built-up grid
Idadi ya watu ya kihistoria na inayokadiriwa ya Minton
Idadi ya watu inayokadiriwa kutoka 0 hadi 2100
Vyanzo:
- JRC (European Commission's Joint Research Centre) kazi ya GHS built-up grid
- CIESIN (Center for International Earth Science Information Network)
- [Kiunga] Klein Goldewijk, K., Beusen, A., Doelman, J., and Stehfest, E.: Anthropogenic land use estimates for the Holocene – HYDE 3.2, Earth Syst. Sci. Data, 9, 927–953, https://doi.org/10.5194/essd-9-927-2017, 2017.
Kielelezo cha Maendeleo ya Binadamu (HDI)
Faharisi ya takwimu ya kitisho cha kuishi, elimu, na mapato ya kila mtu.
Chanzo: [Kiunga] Kummu, M., Taka, M. &Guillaume, J. Gridded global datasets for Gross Domestic Product and Human Development Index over 1990–2015. Sci Data 5, 180004 (2018) doi:10.1038/sdata.2018.4
Utoaji wa CO2 wa Minton
Carbon Dioxide (CO2) Uzalishaji wa hewa kwa Capita huko Tonnes kwa mwaka
| Location | Uzalishaji wa CO2 | Uzalishaji wa CO2 kwa Capita | Uzito wa uzalishaji wa CO2 |
|---|---|---|---|
| Minton | 1,057 tn | 15.32 tn | 3,381.7 tons/km² |
| Saskatchewan | 14,964,194 tn | 13.41 tn | 22.9 tons/km² |
| Kanada | 521,999,336 tn | 14.7 tn | 52.9 tons/km² |
Vyanzo: [Kiunga] Moran, D., Kanemoto K; Jiborn, M., Wood, R., Többen, J., and Seto, K.C. (2018) Carbon footprints of 13,000 cities. Environmental Research Letters DOI: 10.1088/1748-9326/aac72a
Utoaji wa CO2 wa Minton
| Utoaji wa CO2 wa 2013 (tani/mwaka) | 1,057 tn |
| Utoaji wa CO2 wa 2013 (tani/mwaka) kwa mtu | 15.32 tn |
| Nguvu ya utoaji wa CO2 wa 2013 (tani/km²/mwaka) | 3,381.7 tons/km² |
Hatari ya Hatari za Asili
Hatari ya jamaa kati ya 10
| Hatari | Ngazi ya hatari |
|---|---|
| Ukame | Wastani (5) |
| Mtetemeko wa ardhi | Chini (2) |
* Hatari, haswa juu ya mafuriko au maporomoko ya ardhi, inaweza kuwa sio kwa eneo lote.
Vyanzo:
- Dilley, M., R.S. Chen, U. Deichmann, A.L. Lerner-Lam, M. Arnold, J. Agwe, P. Buys, O. Kjekstad, B. Lyon, and G. Yetman. 2005. Natural Disaster Hotspots: A Global Risk Analysis. Washington, D.C.: World Bank. https://doi.org/10.1596/0-8213-5930-4.
- Center for Hazards and Risk Research - CHRR - Columbia University, Center for International Earth Science Information Network - CIESIN - Columbia University, and International Research Institute for Climate and Society - IRI - Columbia University. 2005. Global Drought Hazard Frequency and Distribution. Palisades, NY: NASA Socioeconomic Data and Applications Center (SEDAC). https://doi.org/10.7927/H4VX0DFT.
- Center for Hazards and Risk Research - CHRR - Columbia University, Center for International Earth Science Information Network - CIESIN - Columbia University. 2005. Global Earthquake Hazard Distribution - Peak Ground Acceleration. Palisades, NY: NASA Socioeconomic Data and Applications Center (SEDAC). https://doi.org/10.7927/H4BZ63ZS.
Matetemeko ya Ardhi ya hivi karibuni
Uzito 3.0 na zaidi
| Tarehe▼ | Wakati↕ | Magnitude↕ | Distance↕ | Undani↕ | Location↕ | Kiunga |
|---|---|---|---|---|---|---|
| 2/25/14 | 10:45 PM | 3.8 | 92.3 km | 5,000 m | 51km SSW of Plentywood, Montana | usgs.gov |
| 11/11/98 | 11:59 AM | 3.5 | 79.9 km | 5,000 m | eastern Montana | usgs.gov |
| 7/29/98 | 3:31 AM | 3.8 | 89.1 km | 5,000 m | eastern Montana | usgs.gov |
| 8/17/82 | 4:49 AM | 4.3 | 59.3 km | 18,000 m | Saskatchewan, Canada | usgs.gov |
| 3/9/82 | 1:10 PM | 3.3 | 83.3 km | 18,000 m | eastern Montana | usgs.gov |
| 9/5/75 | 8:47 PM | 3.85 | 90.4 km | 5,000 m | eastern Montana | usgs.gov |
| 6/25/43 | 4:25 AM | 4 | 80.2 km | — | eastern Montana | usgs.gov |
| 5/16/09 | 4:15 AM | 5.5 | 46.5 km | — | Saskatchewan, Canada | usgs.gov |
Chanzo: U.S. Geological Survey (USGS)


Kuhusu Takwimu Zetu
Data katika ukurasa huu inakadiriwa kwa kutumia zana na rasilimali kadhaa zinazopatikana hadharani. Inatolewa bila dhamana, na inaweza kuwa na makosa. Tumia kwa hatari yako mwenyewe.