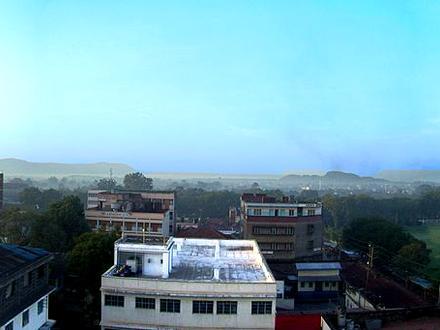
Biashara katika Kipkelion
| Eneo la Kipkelion, Wilaya ya Kericho | km² 0.358 |
| Idadi ya Watu | 1771 |
| Idadi ya Wanaume | 893 (50.4%) |
| Idadi ya Wanawake | 878 (49.6%) |
| Mabadiliko ya idadi ya watu kutoka 1975 hadi 2015 | +6,459.3% |
| Mabadiliko ya idadi ya watu kutoka 2000 hadi 2015 | +60.6% |
| Umri Wastani | 16.4 |
| Umri Wastani wa Mwanaume | 16.2 |
| Umri Wastani wa Mwanamke | 16.7 |
| wakati wa Kawaida | Jumatatu 13:55 |
| Ukanda wa saa | Saa za Afrika Mashariki |
| Latitudo na Longitudo | -0.19675° / 35.46847° |
Kipkelion, Wilaya ya Kericho - Ramani
Idadi ya Kipkelion, Wilaya ya Kericho
Miaka 1975 hadi 2015| Takwimu | 1975 | 1990 | 2000 | 2015 |
|---|---|---|---|---|
| Idadi ya Watu | 27 | 770 | 1103 | 1771 |
| Uzani wa Idadi ya Watu | 75.4 / km² | 2150 / km² | 3080 / km² | 4946 / km² |
Mabadiliko ya idadi ya watu Kipkelion kutoka 2000 hadi 2015
Kuongezeka kwa 60.6% kutoka 2000 hadi 2015| Location | Badilisha tangu 1975 | Badilisha tangu 1990 | Badilisha tangu 2000 |
|---|---|---|---|
| Kipkelion, Wilaya ya Kericho | +6,459.3% | +130% | +60.6% |
| Rift Valley | +355.1% | +128.7% | +60.2% |
| Kenya | +241.7% | +96.8% | +48.4% |
Kipkelion, Wilaya ya Kericho Umri wa kati
Umri wa Kati: miaka 16.4| Location | Umri Wastani | Umri wa Kati (Kike) | Umri wa Kati (Mwanaume) |
|---|---|---|---|
| Kipkelion, Wilaya ya Kericho | miaka 16.4 | miaka 16.7 | miaka 16.2 |
| Rift Valley | miaka 16.9 | miaka 17.2 | miaka 16.7 |
| Kenya | miaka 18 | miaka 18.4 | miaka 17.6 |
Mti wa Idadi ya wakazi wa Kipkelion, Wilaya ya Kericho
Idadi ya Watu Kwa Umri na Jinsia| Umri | Mwanaume | Mwanamke | Jumla |
|---|---|---|---|
| Chini ya 5 | 152 | 147 | 300 |
| 5-9 | 145 | 136 | 281 |
| 10-14 | 125 | 122 | 247 |
| 15-19 | 102 | 97 | 200 |
| 20-24 | 82 | 92 | 174 |
| 25-29 | 65 | 65 | 130 |
| 30-34 | 53 | 50 | 104 |
| 35-39 | 44 | 40 | 84 |
| 40-44 | 29 | 28 | 58 |
| 45-49 | 28 | 31 | 59 |
| 50-54 | 21 | 21 | 42 |
| 55-59 | 16 | 15 | 32 |
| 60-64 | 13 | 12 | 26 |
| 65-69 | 8 | 8 | 17 |
| 70-74 | 6 | 7 | 14 |
| 75-79 | 4 | 5 | 9 |
| 80-84 | 0 | 0 | 0 |
| 85 Pamoja | 0 | 0 | 0 |
Uzani wa Idadi ya Kipkelion, Wilaya ya Kericho
Uzani wa Idadi ya Watu: 4946 / km²| Location | Idadi ya Watu | Area | Uzani wa Idadi ya Watu |
|---|---|---|---|
| Kipkelion, Wilaya ya Kericho | 1771 | km² 0.358 | 4946 / km² |
| Rift Valley | milioni 12.2 | km² 179,926.1 | 67.8 / km² |
| Kenya | milioni 45.8 | km² 582,723.1 | 78.6 / km² |
Kipkelion, Wilaya ya Kericho Kihistoria na Idadi ya Idadi ya Watu
Idadi ya watu waliokadiriwa kutoka 1975 hadi 2100Sources:
1. JRC (European Commission's Joint Research Centre) work on the GHS built-up grid
2. CIESIN (Center for International Earth Science Information Network)
3. [Kiunga] Klein Goldewijk, K., Beusen, A., Doelman, J., and Stehfest, E.: Anthropogenic land use estimates for the Holocene – HYDE 3.2, Earth Syst. Sci. Data, 9, 927–953, https://doi.org/10.5194/essd-9-927-2017, 2017.
Kielelezo cha Maendeleo ya Binadamu (HDI)
Faharisi ya takwimu ya kitisho cha kuishi, elimu, na mapato ya kila mtu.Sources: [Link] Kummu, M., Taka, M. & Guillaume, J. Gridded global datasets for Gross Domestic Product and Human Development Index over 1990–2015. Sci Data 5, 180004 (2018) doi:10.1038/sdata.2018.4
Uzalishaji wa Kipkelion, Wilaya ya Kericho CO2
Carbon Dioxide (CO2) Uzalishaji wa hewa kwa Capita huko Tonnes kwa mwaka| Location | Uzalishaji wa CO2 | Uzalishaji wa CO2 kwa Capita | Uzito wa uzalishaji wa CO2 |
|---|---|---|---|
| Kipkelion, Wilaya ya Kericho | tani fupi 1,223 | tani fupi 0.69 | 3,416 tani fupi/km² |
| Rift Valley | tani fupi 7,426,385 | tani fupi 0.61 | 41.3 tani fupi/km² |
| Kenya | tani fupi 27,341,523 | tani fupi 0.6 | 46.9 tani fupi/km² |
Uzalishaji wa Kipkelion, Wilaya ya Kericho CO2
| Uzalishaji wa CO2 2013 (tani/mwaka) | tani fupi 1,223 |
| Uzalishaji wa 2013 CO2 (tani/mwaka) kwa kila mtu | tani fupi 0.69 |
| Uzalishaji wa uzalishaji wa 2013 (tani/km²/mwaka) | 3,416 tani fupi/km² |
Hatari ya Hatari za Asili
Hatari ya jamaa kati ya 10| Ukame | Kati (4) |
| Mafuriko | Juu (9) |
| Mtetemeko wa ardhi | Kati (4) |
* Hatari, haswa juu ya mafuriko au maporomoko ya ardhi, inaweza kuwa sio kwa eneo lote.
Sources: 1. Dilley, M., R.S. Chen, U. Deichmann, A.L. Lerner-Lam, M. Arnold, J. Agwe, P. Buys, O. Kjekstad, B. Lyon, and G. Yetman. 2005. Natural Disaster Hotspots: A Global Risk Analysis. Washington, D.C.: World Bank. https://doi.org/10.1596/0-8213-5930-4.
2. Center for Hazards and Risk Research - CHRR - Columbia University, Center for International Earth Science Information Network - CIESIN - Columbia University, and International Research Institute for Climate and Society - IRI - Columbia University. 2005. Global Drought Hazard Frequency and Distribution. Palisades, NY: NASA Socioeconomic Data and Applications Center (SEDAC). https://doi.org/10.7927/H4VX0DFT.
3. Center for Hazards and Risk Research - CHRR - Columbia University, Center for International Earth Science Information Network - CIESIN - Columbia University. 2005. Global Flood Hazard Frequency and Distribution. Palisades, NY: NASA Socioeconomic Data and Applications Center (SEDAC). https://doi.org/10.7927/H4668B3D.
4. Center for Hazards and Risk Research - CHRR - Columbia University, Center for International Earth Science Information Network - CIESIN - Columbia University. 2005. Global Earthquake Hazard Distribution - Peak Ground Acceleration. Palisades, NY: NASA Socioeconomic Data and Applications Center (SEDAC). https://doi.org/10.7927/H4BZ63ZS.
Matetemeko ya Ardhi ya hivi karibuni
Uzito 3.0 na zaidi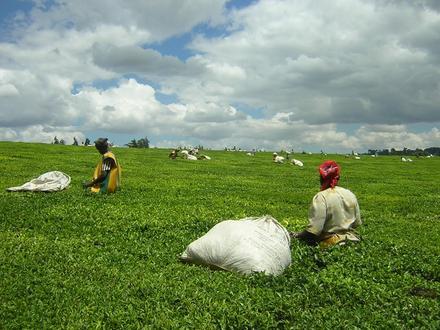


Kuhusu Takwimu Zetu
Data kwenye ukurasa huu inakadiriwa kutumia idadi ya vifaa na rasilimali zinazopatikana hadharani. Imetolewa bila dhamana, na inaweza kuwa na uadilifu. Tumia kwa hatari yako mwenyewe. Tazama hapa kwa habari zaidi.