Ukweli wa Cerna
| Area | 2.8 km² |
| Idadi ya Watu | 1,434 |
| Idadi ya Wanaume | 725 (50.5%) |
| Idadi ya Wanawake | 709 (49.5%) |
| Mabadiliko ya idadi ya watu (1975 to 2020) | -59.2% |
| Mabadiliko ya idadi ya watu (2000 to 2020) | -38.6% |
| Umri Wastani | Miaka 43.9 (Mwanamume: 42.3, Mwanamke: 46.7) |
| wakati wa Kawaida | |
| Ukanda wa saa | Saa za Majira ya joto za Mashariki mwa Ulaya |
| Latitudo na Longitudo | 45.08333, 28.31667 |
| Posta | 827045 |
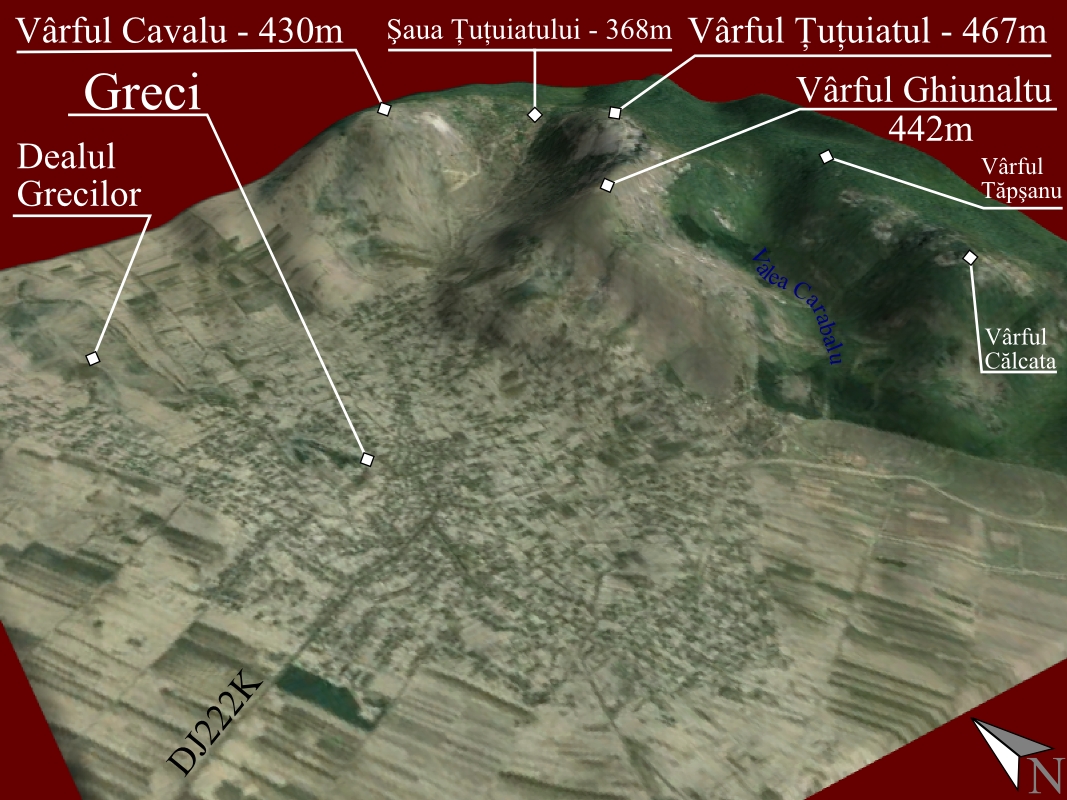
Ramani ya Cerna
Ramani inayoingiliana
Idadi ya watu ya Cerna
Miaka 1975 hadi 2020
| Data | 1975 | 1990 | 2000 | 2015 | 2020 |
|---|---|---|---|---|---|
| Idadi ya Watu | 3,512 | 2,844 | 2,337 | 1,520 | 1,434 |
| Uzani wa Idadi ya Watu | 1,277.1 / km² | 1,034.2 / km² | 849.8 / km² | 552.7 / km² | 521.5 / km² |
Vyanzo: JRC (European Commission's Joint Research Centre) kazi ya GHS built-up grid
Mabadiliko ya idadi ya watu ya Cerna kutoka 2000 hadi 2015
Kupungua kwa 35% kutoka mwaka 2000 hadi 2015
| Location | Mabadiliko tangu 1975 | Mabadiliko tangu 1990 | Mabadiliko tangu 2000 |
|---|---|---|---|
| Cerna | -56.7% | -46.6% | -35% |
| Tulcea | -47.5% | -42.9% | -32.1% |
| Romania | -9.9% | -16.9% | -11.8% |
Vyanzo: JRC (European Commission's Joint Research Centre) kazi ya GHS built-up grid
Umri wa wastani wa Cerna
Umri wa wastani: miaka 43.9
| Location | Umri Wastani | Umri wa Kati (Kike) | Umri wa Kati (Mwanaume) |
|---|---|---|---|
| Cerna | 43.9 yrs | 46.7 yrs | 42.3 yrs |
| Tulcea | 41.3 yrs | 42.7 yrs | 39.9 yrs |
| Romania | 40.1 yrs | 41.6 yrs | 38.5 yrs |
Vyanzo: CIESIN (Center for International Earth Science Information Network)
Msongamano wa watu wa Cerna
Msongamano wa watu: 522 / km²
| Location | Idadi ya Watu | Area | Msongamano |
|---|---|---|---|
| Cerna | 1,434 | 2.75 km² | 522 / km² |
| Tulcea | 185,186 | 8,499.3 km² | 21.8 / km² |
| Romania | 19.5 million | 238,387.8 km² | 81.8 / km² |
Vyanzo: JRC (European Commission's Joint Research Centre) kazi ya GHS built-up grid
Idadi ya watu ya kihistoria na inayokadiriwa ya Cerna
Idadi ya watu inayokadiriwa kutoka 0 hadi 2100
Vyanzo:
- JRC (European Commission's Joint Research Centre) kazi ya GHS built-up grid
- CIESIN (Center for International Earth Science Information Network)
- [Kiunga] Klein Goldewijk, K., Beusen, A., Doelman, J., and Stehfest, E.: Anthropogenic land use estimates for the Holocene – HYDE 3.2, Earth Syst. Sci. Data, 9, 927–953, https://doi.org/10.5194/essd-9-927-2017, 2017.
Posta
Asilimia ya biashara kwa Misimbo ya Posta katika Cerna
Kielelezo cha Maendeleo ya Binadamu (HDI)
Faharisi ya takwimu ya kitisho cha kuishi, elimu, na mapato ya kila mtu.
Chanzo: [Kiunga] Kummu, M., Taka, M. &Guillaume, J. Gridded global datasets for Gross Domestic Product and Human Development Index over 1990–2015. Sci Data 5, 180004 (2018) doi:10.1038/sdata.2018.4
Utoaji wa CO2 wa Cerna
Carbon Dioxide (CO2) Uzalishaji wa hewa kwa Capita huko Tonnes kwa mwaka
| Location | Uzalishaji wa CO2 | Uzalishaji wa CO2 kwa Capita | Uzito wa uzalishaji wa CO2 |
|---|---|---|---|
| Cerna | 6,265 tn | 4.37 tn | 2,278 tons/km² |
| Tulcea | 809,240 tn | 4.37 tn | 95.2 tons/km² |
| Romania | 86,961,323 tn | 4.46 tn | 364.8 tons/km² |
Vyanzo: [Kiunga] Moran, D., Kanemoto K; Jiborn, M., Wood, R., Többen, J., and Seto, K.C. (2018) Carbon footprints of 13,000 cities. Environmental Research Letters DOI: 10.1088/1748-9326/aac72a
Utoaji wa CO2 wa Cerna
| Utoaji wa CO2 wa 2013 (tani/mwaka) | 6,265 tn |
| Utoaji wa CO2 wa 2013 (tani/mwaka) kwa mtu | 4.37 tn |
| Nguvu ya utoaji wa CO2 wa 2013 (tani/km²/mwaka) | 2,278 tons/km² |
Hatari ya Hatari za Asili
Hatari ya jamaa kati ya 10
| Hatari | Ngazi ya hatari |
|---|---|
| Ukame | Chini (2) |
| Mafuriko | Wastani (4) |
| Mtetemeko wa ardhi | Wastani (6) |
* Hatari, haswa juu ya mafuriko au maporomoko ya ardhi, inaweza kuwa sio kwa eneo lote.
Vyanzo:
- Dilley, M., R.S. Chen, U. Deichmann, A.L. Lerner-Lam, M. Arnold, J. Agwe, P. Buys, O. Kjekstad, B. Lyon, and G. Yetman. 2005. Natural Disaster Hotspots: A Global Risk Analysis. Washington, D.C.: World Bank. https://doi.org/10.1596/0-8213-5930-4.
- Center for Hazards and Risk Research - CHRR - Columbia University, Center for International Earth Science Information Network - CIESIN - Columbia University, and International Research Institute for Climate and Society - IRI - Columbia University. 2005. Global Drought Hazard Frequency and Distribution. Palisades, NY: NASA Socioeconomic Data and Applications Center (SEDAC). https://doi.org/10.7927/H4VX0DFT.
- Center for Hazards and Risk Research - CHRR - Columbia University, Center for International Earth Science Information Network - CIESIN - Columbia University. 2005. Global Flood Hazard Frequency and Distribution. Palisades, NY: NASA Socioeconomic Data and Applications Center (SEDAC). https://doi.org/10.7927/H4668B3D.
- Center for Hazards and Risk Research - CHRR - Columbia University, Center for International Earth Science Information Network - CIESIN - Columbia University. 2005. Global Earthquake Hazard Distribution - Peak Ground Acceleration. Palisades, NY: NASA Socioeconomic Data and Applications Center (SEDAC). https://doi.org/10.7927/H4BZ63ZS.
Matetemeko ya Ardhi ya hivi karibuni
Uzito 3.0 na zaidi
| Tarehe▼ | Wakati↕ | Magnitude↕ | Distance↕ | Undani↕ | Location↕ | Kiunga |
|---|---|---|---|---|---|---|
| 8/16/17 | 3:16 PM | 4.3 | 56.7 km | 12,850 m | 4km NNE of Smirdan, Romania | usgs.gov |
| 9/30/13 | 5:01 AM | 4.1 | 60.8 km | 4,900 m | 2km SW of Schela, Romania | usgs.gov |
| 9/29/13 | 6:10 PM | 4.1 | 58.7 km | 5,000 m | 2km ESE of Schela, Romania | usgs.gov |
| 10/30/07 | 5:56 PM | 4.1 | 71.1 km | 50,000 m | Romania | usgs.gov |
| 1/7/07 | 2:25 PM | 3.2 | 96.5 km | 15,000 m | Romania | usgs.gov |
| 3/25/06 | 9:05 AM | 3 | 37.4 km | 5,000 m | Romania | usgs.gov |
| 2/6/06 | 10:47 AM | 3.6 | 43.6 km | 30,000 m | Romania | usgs.gov |
| 1/4/06 | 11:53 PM | 3.7 | 61.2 km | 10,000 m | Ukraine-Romania border region | usgs.gov |
| 10/27/05 | 4:37 AM | 3.4 | 41.1 km | 11,300 m | Romania | usgs.gov |
| 9/10/05 | 4:42 PM | 3.6 | 86 km | 1,000 m | Romania | usgs.gov |
Chanzo: U.S. Geological Survey (USGS)

Kuhusu Takwimu Zetu
Data katika ukurasa huu inakadiriwa kwa kutumia zana na rasilimali kadhaa zinazopatikana hadharani. Inatolewa bila dhamana, na inaweza kuwa na makosa. Tumia kwa hatari yako mwenyewe.