Kategoria katika Pathum Rat
Kituo cha GesiMarekebisho na Matengenezo ya MagariMuuza PikipikiPikipiki kukarabatiUtengenezaji wa magariUkulimaWauzaji wa jumlaMaduka ya nguoSimu ya mkononi madukaBuddhist hekaluKituo cha JumuiyaMashirika na Maeneo ya Kidini ya JumlaOfisi ya SerikaliOfisi ya Utawala wa ManispaaPostaShirika Lisilo la FaidaUkumbi wa JijiDuka la ElektronikiDuka la Matengenezo ya UmemeDuka la Bidhaa za NyumbaniDuka la Vifaa vya ujenziMajengo ya MakaziElimuShule ya MwanzoShule za KatikatiDuka la TambiKahawa migahawaKufunga chakula migahawaMaduka ya kahawaMaduka ya vyakula na makubwaMchinjajiMikahawaUokaji mikateVitalu vya na vifaa bustaniAsubuhi yaBenkiHospitali KuuKituo cha Afya cha JamiiSaluni ya NyweleZa saluniDuka la dawaDuka la JumlaDuka la Vifaa vya MwashiKituo cha UnunuziManunuziRanchiUrahisi madukaBohariHoteli na motelsMatembezi
Inaonyesha 1-50 kati ya 52
Viwanda
Mgawanyo wa biashara kwa sekta katika Pathum Rat
| Maelezo ya Viwanda | Idadi ya Uanzishwaji |
|---|---|
| Dini | 81 |
| Mikahawa | 60 |
| Manunuzi | 49 |
| Usimamizi wa umma | 44 |
| Maduka ya vyakula na makubwa | 42 |
| Mashirika mengine ya uanachama | 42 |
| Haifikiwi | 33 |
| Elimu | 32 |
| Shule ya msingi ya msingi na | 22 |
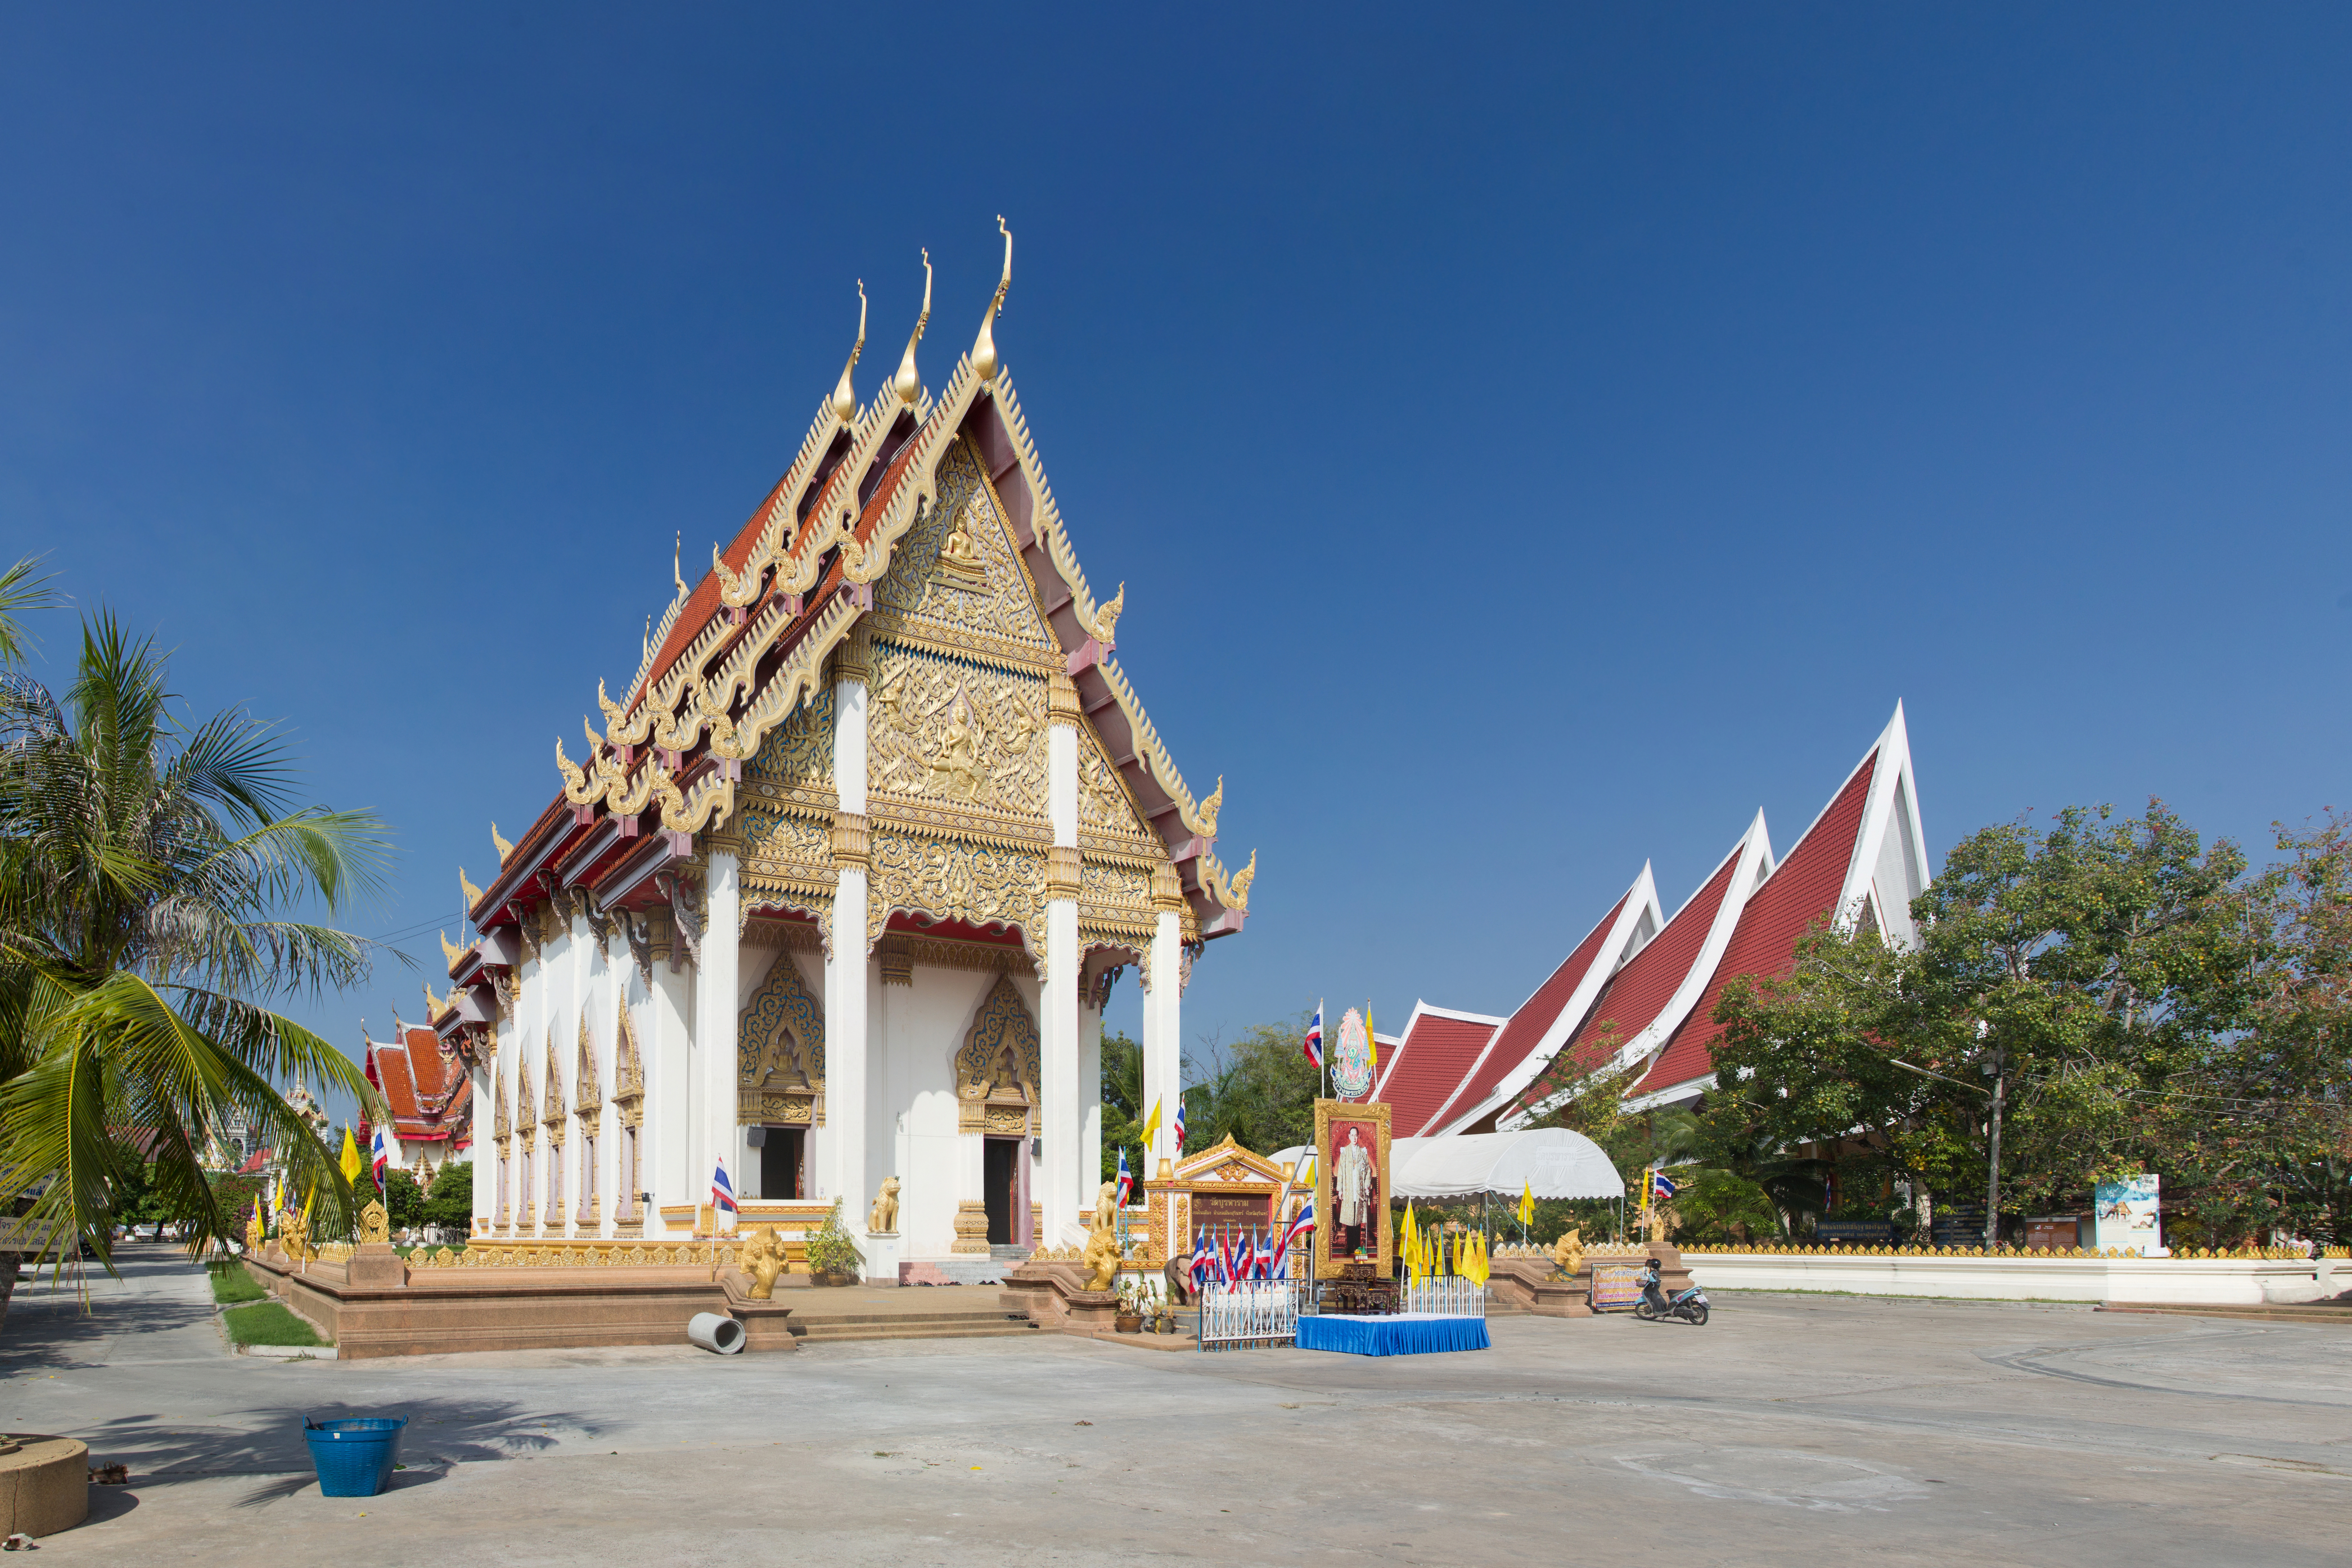
| Buddhist hekalu | 20 |
| Kahawa migahawa | 19 |
| Nyingine malazi | 17 |
| Kituo cha kuuza mafuta | 15 |
| Matrekta na Vifaa vya mashamba | 14 |
| Hospitali | 13 |
Ukweli wa Pathum Rat
| Area | 6.0 km² |
| Idadi ya Watu | 1,244 |
| Idadi ya Wanaume | 608 (48.9%) |
| Idadi ya Wanawake | 636 (51.1%) |
| Mabadiliko ya idadi ya watu (1975 to 2020) | +21.0% |
| Mabadiliko ya idadi ya watu (2000 to 2020) | -24.5% |
| Umri Wastani | Miaka 34.7 (Mwanamume: 33.8, Mwanamke: 35.6) |
| Mitaa | ปทุมรัตต์, Thung Thong, บัวแดง |
| wakati wa Kawaida | |
| Ukanda wa saa | Saa za Indochina |
| Latitudo na Longitudo | 15.63450, 103.34325 |
| Posta | 45190 |
Ramani ya Pathum Rat
Ramani inayoingiliana
Idadi ya watu ya Pathum Rat
Miaka 1975 hadi 2020
| Data | 1975 | 1990 | 2000 | 2015 | 2020 |
|---|---|---|---|---|---|
| Idadi ya Watu | 1,028 | 1,521 | 1,647 | 1,212 | 1,244 |
| Uzani wa Idadi ya Watu | 171.3 / km² | 253.5 / km² | 274.5 / km² | 202 / km² | 207.3 / km² |
Vyanzo: JRC (European Commission's Joint Research Centre) kazi ya GHS built-up grid
Mabadiliko ya idadi ya watu ya Pathum Rat kutoka 2000 hadi 2015
Kupungua kwa 26.4% kutoka mwaka 2000 hadi 2015
| Location | Mabadiliko tangu 1975 | Mabadiliko tangu 1990 | Mabadiliko tangu 2000 |
|---|---|---|---|
| Pathum Rat | +17.9% | -20.3% | -26.4% |
| Changwat Roi Et | -38.4% | -42.7% | -31.2% |
| Uthai | +60.4% | +20.1% | +8.3% |
Vyanzo: JRC (European Commission's Joint Research Centre) kazi ya GHS built-up grid
Umri wa wastani wa Pathum Rat
Umri wa wastani: miaka 34.7
| Location | Umri Wastani | Umri wa Kati (Kike) | Umri wa Kati (Mwanaume) |
|---|---|---|---|
| Pathum Rat | 34.7 yrs | 35.6 yrs | 33.8 yrs |
| Changwat Roi Et | 34.7 yrs | 35.6 yrs | 33.8 yrs |
| Uthai | 35.2 yrs | 36 yrs | 34.3 yrs |
Vyanzo: CIESIN (Center for International Earth Science Information Network)
Msongamano wa watu wa Pathum Rat
Msongamano wa watu: 207 / km²
| Location | Idadi ya Watu | Area | Msongamano |
|---|---|---|---|
| Pathum Rat | 1,244 | 6 km² | 207 / km² |
| Changwat Roi Et | 564 | 3.123 km² | 181 / km² |
| Uthai | 67.6 million | 514,961.7 km² | 131 / km² |
Vyanzo: JRC (European Commission's Joint Research Centre) kazi ya GHS built-up grid
Idadi ya watu ya kihistoria na inayokadiriwa ya Pathum Rat
Idadi ya watu inayokadiriwa kutoka 400 hadi 2100
Vyanzo:
- JRC (European Commission's Joint Research Centre) kazi ya GHS built-up grid
- CIESIN (Center for International Earth Science Information Network)
- [Kiunga] Klein Goldewijk, K., Beusen, A., Doelman, J., and Stehfest, E.: Anthropogenic land use estimates for the Holocene – HYDE 3.2, Earth Syst. Sci. Data, 9, 927–953, https://doi.org/10.5194/essd-9-927-2017, 2017.
Mgawanyo wa bei
Ugawaji wa biashara kwa bei ya Pathum Rat
Kielelezo cha Maendeleo ya Binadamu (HDI)
Faharisi ya takwimu ya kitisho cha kuishi, elimu, na mapato ya kila mtu.
Chanzo: [Kiunga] Kummu, M., Taka, M. &Guillaume, J. Gridded global datasets for Gross Domestic Product and Human Development Index over 1990–2015. Sci Data 5, 180004 (2018) doi:10.1038/sdata.2018.4
Utoaji wa CO2 wa Pathum Rat
Carbon Dioxide (CO2) Uzalishaji wa hewa kwa Capita huko Tonnes kwa mwaka
| Location | Uzalishaji wa CO2 | Uzalishaji wa CO2 kwa Capita | Uzito wa uzalishaji wa CO2 |
|---|---|---|---|
| Pathum Rat | 4,854 tn | 3.9 tn | 809.1 tons/km² |
| Changwat Roi Et | 2,201 tn | 3.9 tn | 704.8 tons/km² |
| Uthai | 278,589,420 tn | 4.12 tn | 541 tons/km² |
Vyanzo: [Kiunga] Moran, D., Kanemoto K; Jiborn, M., Wood, R., Többen, J., and Seto, K.C. (2018) Carbon footprints of 13,000 cities. Environmental Research Letters DOI: 10.1088/1748-9326/aac72a
Utoaji wa CO2 wa Pathum Rat
| Utoaji wa CO2 wa 2013 (tani/mwaka) | 4,854 tn |
| Utoaji wa CO2 wa 2013 (tani/mwaka) kwa mtu | 3.9 tn |
| Nguvu ya utoaji wa CO2 wa 2013 (tani/km²/mwaka) | 809.1 tons/km² |
Hatari ya Hatari za Asili
Hatari ya jamaa kati ya 10
| Hatari | Ngazi ya hatari |
|---|---|
| Ukame | Wastani (7) |
| Mafuriko | Juu (10) |
| Mtetemeko wa ardhi | Chini (2) |
* Hatari, haswa juu ya mafuriko au maporomoko ya ardhi, inaweza kuwa sio kwa eneo lote.
Vyanzo:
- Dilley, M., R.S. Chen, U. Deichmann, A.L. Lerner-Lam, M. Arnold, J. Agwe, P. Buys, O. Kjekstad, B. Lyon, and G. Yetman. 2005. Natural Disaster Hotspots: A Global Risk Analysis. Washington, D.C.: World Bank. https://doi.org/10.1596/0-8213-5930-4.
- Center for Hazards and Risk Research - CHRR - Columbia University, Center for International Earth Science Information Network - CIESIN - Columbia University, and International Research Institute for Climate and Society - IRI - Columbia University. 2005. Global Drought Hazard Frequency and Distribution. Palisades, NY: NASA Socioeconomic Data and Applications Center (SEDAC). https://doi.org/10.7927/H4VX0DFT.
- Center for Hazards and Risk Research - CHRR - Columbia University, Center for International Earth Science Information Network - CIESIN - Columbia University. 2005. Global Flood Hazard Frequency and Distribution. Palisades, NY: NASA Socioeconomic Data and Applications Center (SEDAC). https://doi.org/10.7927/H4668B3D.
- Center for Hazards and Risk Research - CHRR - Columbia University, Center for International Earth Science Information Network - CIESIN - Columbia University. 2005. Global Earthquake Hazard Distribution - Peak Ground Acceleration. Palisades, NY: NASA Socioeconomic Data and Applications Center (SEDAC). https://doi.org/10.7927/H4BZ63ZS.

Kuhusu Takwimu Zetu
Data katika ukurasa huu inakadiriwa kwa kutumia zana na rasilimali kadhaa zinazopatikana hadharani. Inatolewa bila dhamana, na inaweza kuwa na makosa. Tumia kwa hatari yako mwenyewe.